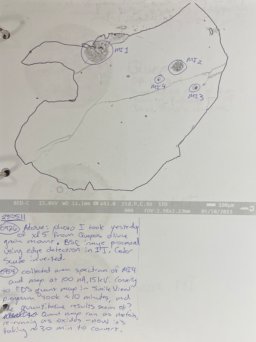
Igneous samples

Outline

Samples and previous work

These are the samples I have available at the time of writing:

Miscellaneous figures

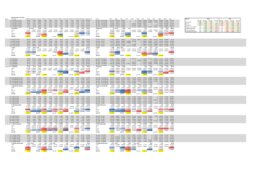
240411 -- Here is what my notes say: Testing to see how EDS compares to my 15 kV/10 nA basalt recipe on WDS. For WDS, using mostly the same recipe for WDS as 231106, but count times are increased from 20/10 to 40/20. 5 replicates of each sample. ZAF, oxides calculating oxygen by difference. For EDS, using 30s acquisition with T3 process time (~30% dead time). Postage stamp sized area analyses as viewed at 900x magnification. WDS calibration takes about 45 minutes. EDS acquisition of standards calculated to be about 11 minutes. Calculated run time for WDS is 2h:41m. Calculated run time for EDS is 28 minutes.

Reprocessed the data to fix some mistakes on 241101. I'm not sure I originally did everything right in DTSA-II, but now it should be correct. The printed-to-pdf spreadsheet is mostly self-explanatory, and I came up with a few metrics (small table in upper right) to reduce the multielement analysis of the materials to a single error score. The cells are shaded green or orange depending on which analysis method "won" or "lost" respectively. Generally, the WDS does do better than the EDS, but I am also led to believe that this difference is not significant for most general petrology use cases.

The plot to the right shows the totals of analyses on the WDS vs the EDS where the analyses were paired randomly (i.e. the first analysis of SI Diopside on the WDS is paired with the first analysis of SI Diopside on the EDS). It turns out that the WDS totals are kind of low, and the EDS totals are kind of high. The low WDS totals can probably be explained by spectrometer misalignment; I don't have an explanation for the high EDS totals.
Element 95% error
Al2O3 0.58
CaO 0.34
FeO 0.52
K2O 0.24
MgO 0.44
MnO 0.16
Na2O 0.27
SiO2 0.96
TiO2 0.07
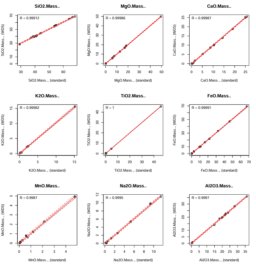
230717 -- Results from analyses of SI standards using WDS (20 kV, 20 nA). Analyses were done on a mixture of our MAC and SI reference materials, and no significant difference was found between the two groups in terms of the accuracy returned by the WDS analyses. Figure: Plots of the reference concentration (X-axis) vs the analyzed concentration (Y-axis) with a 95% prediction envelope calculated using R. Solid red line = linear regression. Dashed red lines = prediction envelopw. Solid gray line = 1:1 line. Table: Average 95% uncertainty for each element (i.e. a mean value that eliminates curvature in the prediction envelopw going away from the median value). So as an example, an analysis would have plus or minus 0.96 wt% uncertainty for SiO2, which is "baked in" as a result of arbitrarily choosing a random mineral standard for the calibration. This wouls be an argument for using "6 nines pure" atandards as recommended by John Donovan.
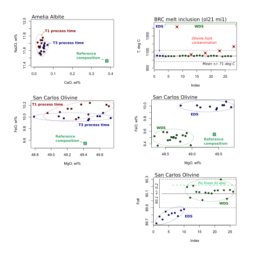
241007 -- WDS analyses of reference minerals compared with EDS analyses with standards-based quantification done usnig DTSA-II. Based on these results, I think it's probably fine to do some very basic petrologic calculations using the EDS data. Temperatures were calculated from glass using one of those easy MgO thermometers. The Fo number range is qoted in John Fournelle's recent (2017?) paper (conference abstract?)about San Carlos olivine.
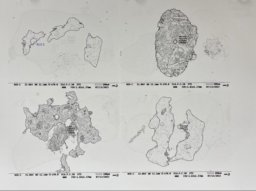
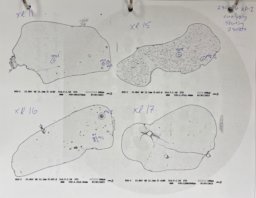
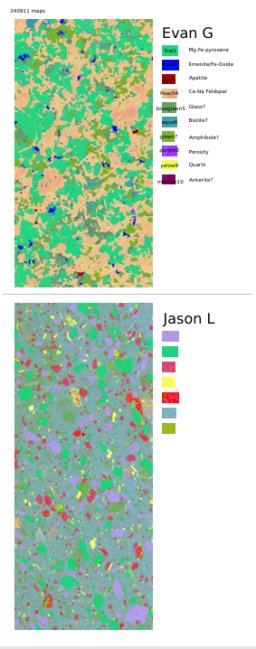
240911 -- PC images of "Evan G" and "Jason L" thin sections.
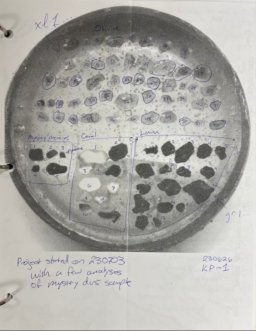
230703 -- Notes from session looking at KP-1 sample.
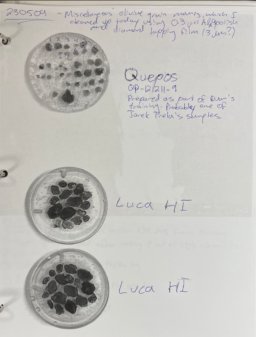
230509 -- notes from session looking at Quepos grain mount with a few recrystalized melt inclusions. It seems like I was planning to maybe also analyze the Luca Hawaii grain mounts but this didn't happen (examining on 241008, it doesn't look like those were C coated, but I'm not totally sure.

Progress log

TODO